8 Key Features of Microsoft Power BI: A Data Analyst's Toolkit
User-Friendly Interface
One of the standout features of Microsoft Power BI is its user-friendly interface, which has been meticulously designed to cater to both novice users and experienced data analysts. This intuitive layout allows users to seamlessly navigate vast datasets, crucial for effective data analysis. The interface supports a range of functionalities that enable users to create insightful reports and visualizations without extensive training or technical expertise.
The drag-and-drop functionality is a particularly noteworthy aspect of Power BI's interface. It simplifies the process of creating visual representations of data, allowing users to easily move different elements around the canvas to design their reports. This feature is not only beneficial for data analysts but also makes it accessible to individuals who may not have a strong background in data processing. With just a few clicks, users can incorporate various charts, graphs, and tables into their reports, creating a visually engaging presentation of their findings.
Moreover, the collaborative tools integrated within Power BI's interface facilitate teamwork among data professionals. Users can share dashboards and reports effortlessly, enabling team members to access and contribute to the analysis in real time. This streamlined approach enhances workflow efficiency, as analysts can gather insights and feedback from their peers, resulting in more comprehensive analyses. Overall, the user-friendly interface of Power BI not only empowers individual analysts but also reinforces collaboration within teams, making it an essential asset for organizations leveraging data intelligence.
Customizable Visualizations
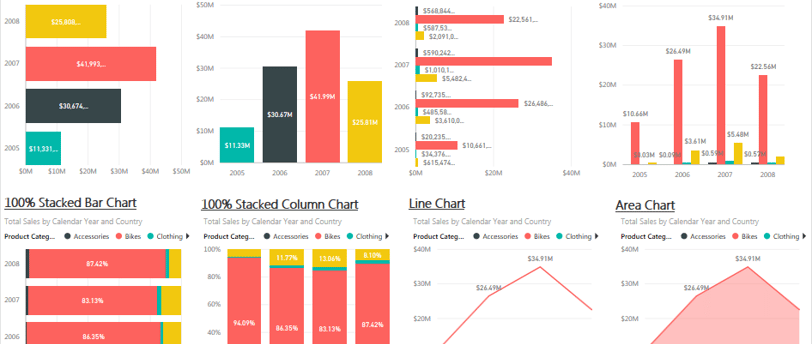
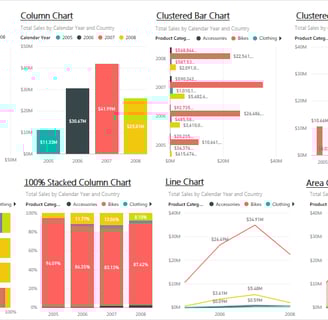
One of the key features of Microsoft Power BI is its extensive array of customizable visualizations, which empower users to tailor their data representation according to specific analysis objectives. Individuals engaged in data analytics can choose from a variety of charts, graphs, maps, and dashboards, allowing for a wide-ranging display of data sets. This flexibility in visualization is crucial, as it enables data analysts to depict complex information in simpler formats, enhancing overall comprehension.
Power BI offers several default visualization types, including bar charts, line graphs, and scatter plots. However, users have the option to further customize these visual elements by altering colors, labels, and sizes. Through the editing tools in Power BI, analysts can modify visualizations to emphasize certain data points or trends that are most relevant to their narrative. This ability to personalize visuals not only aids in clearer communication but also fosters heightened engagement from stakeholders, as they can interpret the data more intuitively when it is displayed in a manner resonant with their understanding.
Moreover, the significance of data storytelling cannot be overstated in today’s data-driven environment. Customized visuals play a pivotal role in this storytelling process. By selecting appropriate chart types and styles, data analysts can construct a compelling narrative that guides stakeholders through the insights derived from the data. This enhanced visual representation not only clarifies key findings but also stimulates discussions around strategies and decisions informed by data insights. Ultimately, the capacity for customization within Power BI serves to elevate analytical capabilities, making it a vital tool for any data analyst seeking to maximize the impact of their business intelligence initiatives.
Real-Time Data Access
In the rapidly changing landscape of business intelligence, real-time data access has emerged as a fundamental requirement for data analysts. Microsoft Power BI addresses this need by providing robust capabilities for live connections to various data sources. This feature allows analysts to access and visualize the most current data available, facilitating informed decision-making. With real-time data integration, organizations can streamline their operational processes, enabling them to react promptly to emerging trends and market conditions.
Power BI supports the integration of diverse data sources, including cloud services, databases, and on-premise data warehouses. This versatility allows data analysts to connect seamlessly to numerous platforms, such as Azure SQL Database, Salesforce, and Google Analytics, providing a comprehensive view of the organization’s data landscape. By bringing together information from disparate sources in real-time, analysts can create dynamic reports that reflect the latest developments, ensuring that stakeholders have access to the most relevant insights.
The ability to generate real-time dashboards significantly enhances the responsiveness of organizations. As market conditions evolve, businesses must be agile in their decision-making. Power BI empowers data analysts to identify shifts in data trends quickly and analyze how these changes may impact business strategies. For example, companies can monitor customer interactions or sales figures as they occur, leading to prompt adjustments in their marketing or operational approaches.
Moreover, the real-time data access capability fosters collaboration across teams, as departments can view and discuss shared, up-to-the-minute information. This shared visibility enables a collective approach to business challenges and fosters more coordinated responses. Overall, the integration of real-time data access in Power BI not only enhances the analytical experience for data analysts but also significantly impacts the overall agility and effectiveness of decision-making within organizations.
Advanced Analytics Tools
Microsoft Power BI is equipped with advanced analytics tools that empower data analysts to derive insights from complex datasets. One notable feature is its support for predictive analytics, which enables analysts to forecast future trends based on historical data. By leveraging statistical algorithms and machine learning techniques, users can create models that predict outcomes, thereby aiding businesses in strategic decision-making.
Another integral component is DAX, which stands for Data Analysis Expressions. DAX is a powerful formula language that allows analysts to perform sophisticated calculations and aggregations on data. With DAX, users can create custom measures, calculate running totals, and apply filters directly in their reports. This capability enhances the analytical depth of Power BI, allowing for nuanced data exploration and improved reporting accuracy.
Furthermore, Power BI integrates seamlessly with programming languages such as R and Python. This feature permits users to leverage the extensive libraries available in these languages for data manipulation, statistical analysis, and machine learning. Analysts can incorporate scripts within Power BI to conduct intricate analyses and visualize outputs directly in their reports. This integration broadens the horizons for data exploration, providing a more flexible and comprehensive analytics environment.
Overall, the advanced analytics tools in Power BI not only facilitate complex calculations and data modeling but also enable the implementation of machine learning processes. As a result, data analysts can uncover deeper insights into data trends and patterns, ultimately leading to more informed business decisions. These features make Power BI a formidable tool in the realm of business intelligence, equipping analysts with the necessary capabilities to tackle modern data challenges.
Collaboration and Sharing Features
Microsoft Power BI significantly enhances collaboration among teams, presenting various sharing capabilities that facilitate cooperative data analysis. Central to this collaboration are workspaces, which allow teams to maintain a shared environment for their reports, dashboards, and datasets. Each workspace serves as a dedicated area where users can collaborate, allowing team members to modify and refine reports collectively. This feature ensures that all members are aligned and that updates made are immediately accessible to everyone, thus streamlining the decision-making process.
Furthermore, the publish-to-web option within Power BI provides users with the ability to share visualizations and reports easily. This feature enables organizations to present data insights to a broader audience without requiring the audience to have a Power BI account. The simplicity of sharing links or embedding visualizations on websites fosters an inclusive communication medium for stakeholders, enhancing overall engagement with data insights.
Integration with Microsoft Teams is another critical aspect of Power BI’s collaboration features. by seamlessly embedding reports and dashboards within Teams, users can engage in real-time discussions about the data they are analyzing. This integration enriches the user experience, permitting individuals to derive insights while simultaneously collaborating on interpretations and implications of the data. Teams can comment directly on the reports, promoting immediate feedback and facilitating faster iterations of analysis.
Security is also paramount when sharing insights across an organization. Power BI ensures that the sharing of data is done securely, restricting access to sensitive information while enabling necessary visibility among users. This layered security model protects company data while still allowing for collaborative efforts, emphasizing the balance between transparency and confidentiality in data management. By leveraging these features, teams can work more effectively, making informed decisions based on data-driven insights together.
Mobile Accessibility
Mobile accessibility is one of the standout features of Microsoft Power BI that significantly enhances its utility for data analysts. By providing users with the ability to access dashboards and reports through mobile devices, Power BI ensures that vital data is always at users' fingertips, regardless of their physical location. This aspect of mobile-friendly design allows for seamless interaction with business intelligence tools, promoting agile decision-making.
Power BI's mobile application is designed with user experience in mind, allowing for easy navigation through reports and visualizations on smaller screens. The tailored interface fosters a clear display of key performance indicators (KPIs) and metrics, ensuring that users can quickly grasp the data insights they need. Moreover, the application's responsive design adapts layouts for various screen sizes, enabling data analysts to view detailed reports and summarize dashboards effectively, whether they are in the office or traveling.
Furthermore, the mobile accessibility feature enhances flexible working conditions for professionals, allowing them to make data-driven decisions on the go. With real-time data access, users can monitor and assess critical performance metrics, respond to changes swiftly, and collaborate with team members without having to return to their desks. This flexibility not only improves the efficiency of workflows but also ensures that organizations can stay competitive in a fast-paced market environment.
Incorporating mobile accessibility into the reporting processes encourages a culture of data-centric decision-making. As data analysts utilize these mobile capabilities, they become empowered to remain proactive, adapting strategies in response to the most current information available. Consequently, Power BI's commitment to mobile functionality plays a crucial role in driving effective business intelligence solutions that prioritize both accessibility and user engagement.
Integration with Other Microsoft Tools
One of the standout features of Microsoft Power BI is its seamless integration with a variety of other Microsoft tools such as Excel, Azure, and SQL Server. This interconnected ecosystem significantly amplifies its utility for data analysts, providing a comprehensive toolkit for business intelligence tasks. Through this integration, analysts can effortlessly import and export data, facilitating a smoother workflow and reducing the time spent on data preparation.
Power BI's compatibility with Excel is particularly beneficial, as users can easily import Excel data models and pivot tables directly into Power BI. This feature allows analysts to leverage existing spreadsheets and pivot analysis without starting from scratch. Moreover, real-time data updates in Excel are reflected in Power BI dashboards, enabling users to maintain consistency across their analyses and reports.
Another crucial integration is with Microsoft Azure. By connecting to Azure databases, data analysts gain access to a powerful cloud-based environment for their data. Azure’s machine learning capabilities further enhance Power BI's analytical offerings, allowing for deeper insights and predictive analytics directly within reports. This cloud connectivity not only provides scalability but also fosters collaboration among teams dispersed across various locations.
Furthermore, the integration with SQL Server empowers analysts to create dynamic reports using extensive databases. With Power BI's data modeling capabilities, users can easily connect to SQL databases, facilitating complex queries and allowing for the visualization of extensive datasets intuitively. The resulting dashboards and reports enable stakeholders to make informed decisions based on real-time data insights.
Collectively, these integrations not only boost productivity but also enhance the overall efficiency of business intelligence tasks. The harmonious collaboration between these Microsoft tools creates a robust ecosystem that serves as an essential part of a data analyst's toolkit.
Custom Alerts and Notifications
Microsoft Power BI includes a powerful feature set designed to enhance the user experience and among these features, custom alerts and notifications stand out. Alerts are essential for data analysts as they enable proactive monitoring of key metrics, ensuring that users are always informed of significant changes without the need of constant dashboard surveillance. By setting specific thresholds on various data points, analysts can receive immediate notifications when those values are met or exceeded, allowing for timely decision-making.
The configuration of these alerts is user-friendly; data analysts can easily define parameters based on their business requirements. For example, a sales analyst may set an alert to notify them if sales drop below a specified threshold or if inventory levels rise above a certain point. These tailored alerts help organizations respond quickly to changing conditions in their operational environment, which can be critical for maintaining a competitive edge.
Power BI supports notifications through various channels, including email and mobile applications, enabling users to stay connected wherever they are. This feature ensures that important updates are never missed, fostering a culture of responsiveness within teams. Moreover, alerts can be set for a range of scenarios, encompassing everything from financial performance metrics to customer engagement statistics, facilitating a holistic view of business health.
In today's data-driven landscape, the ability to receive real-time alerts empowers data analysts to act swiftly on crucial information. By leveraging this functionality, businesses can improve their decision-making agility, ultimately leading to enhanced operational performance and strategic advantage. The integration of custom alerts and notifications in Power BI thus serves as a vital tool in a data analyst's toolkit, promoting proactive management and dynamic response mechanisms as part of an overall business intelligence strategy.